The documentation you are viewing is for Dapr v1.7 which is an older version of Dapr. For up-to-date documentation, see the latest version.
How-To: Set-up New Relic for distributed tracing
先决条件
- Perpetually free New Relic account, 100 GB/month of free data ingest, 1 free full access user, unlimited free basic users
Configure Dapr tracing
Dapr natively captures metrics and traces that can be send directly to New Relic. The easiest way to export these is by configuring Dapr to send the traces to New Relic’s Trace API using the Zipkin trace format.
In order for the integration to send data to New Relic Telemetry Data Platform, you need a New Relic Insights Insert API key.
apiVersion: dapr.io/v1alpha1
kind: Configuration
metadata:
  name: appconfig
  namespace: default
spec:
  tracing:
    samplingRate: "1"
    zipkin:
      endpointAddress: "https://trace-api.newrelic.com/trace/v1?Api-Key=<NR-INSIGHTS-INSERT-API-KEY>&Data-Format=zipkin&Data-Format-Version=2"
查看 Traces
New Relic 分布式追踪概览 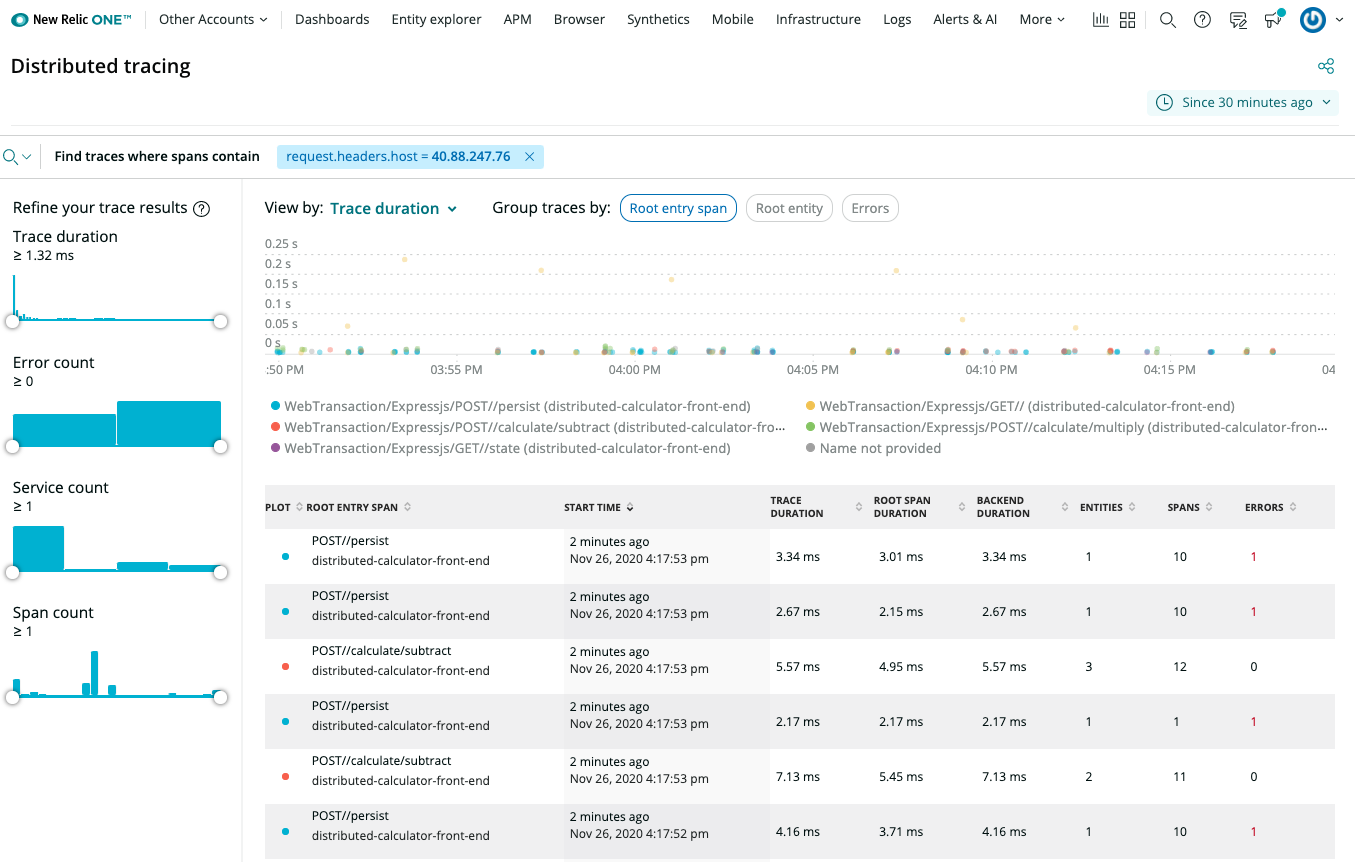
New Relic Distributed Tracing details 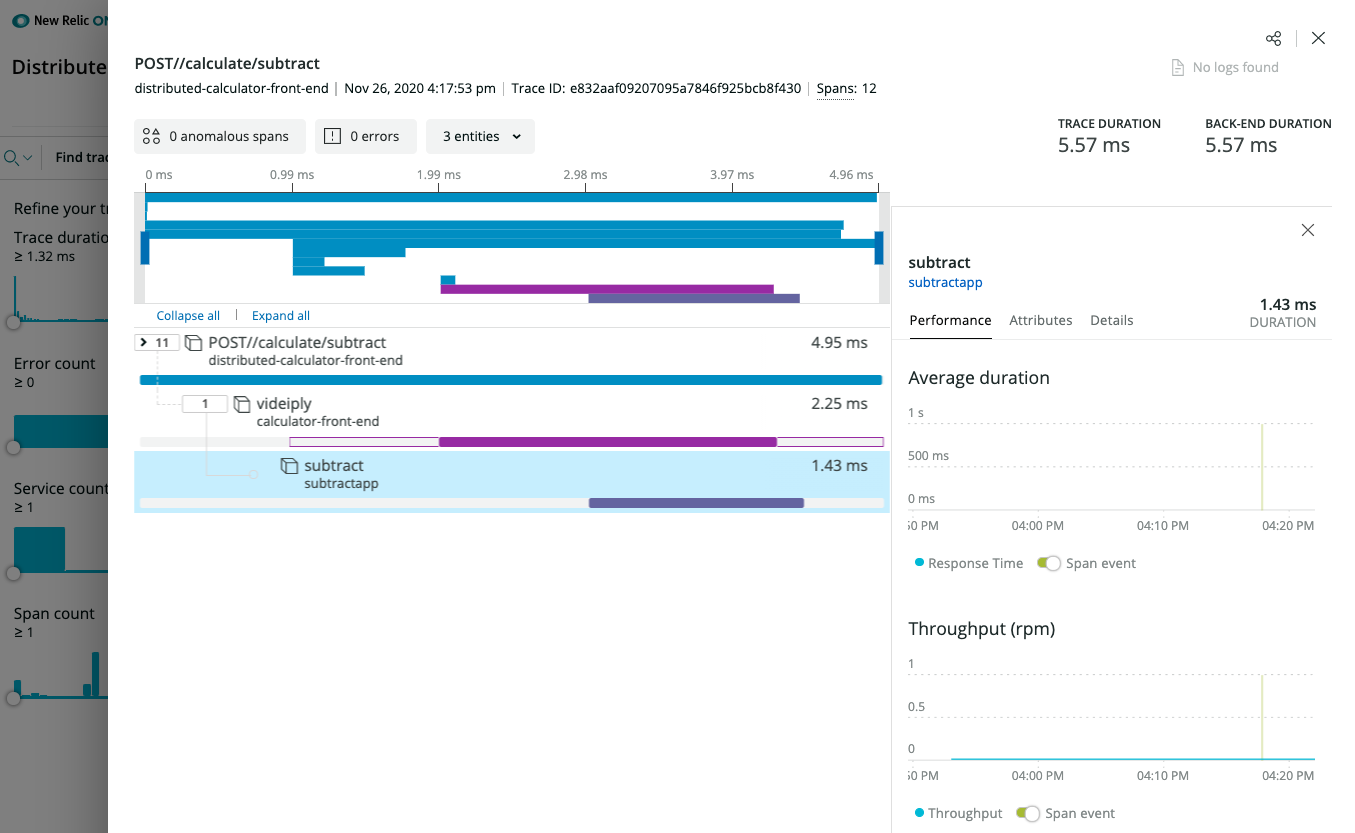
(optional) New Relic Instrumentation
In order for the integrations to send data to New Relic Telemetry Data Platform, you either need a New Relic license key or New Relic Insights Insert API key.
OpenTelemetry instrumentation
Leverage the different language specific OpenTelemetry implementations, for example New Relic Telemetry SDK and OpenTelemetry support for .NET. In this case, use the OpenTelemetry Trace Exporter. 查看示例。
New Relic Language agent
Similarly to the OpenTelemetry instrumentation, you can also leverage a New Relic language agent. 一个例子是 .NET Core 的 New Relic 代理工具 是Docker文件的一部分。 查看示例。
(optional) Enable New Relic Kubernetes integration
In case Dapr and your applications run in the context of a Kubernetes environment, you can enable additional metrics and logs.
The easiest way to install the New Relic Kubernetes integration is to use the automated installer to generate a manifest. It bundles not just the integration DaemonSets, but also other New Relic Kubernetes configurations, like Kubernetes events, Prometheus OpenMetrics, and New Relic log monitoring.
New Relic Kubernetes Cluster Explorer
The New Relic Kubernetes Cluster Explorer provides a unique visualization of the entire data and deployments of the data collected by the Kubernetes integration.
It is a good starting point to observe all your data and dig deeper into any performance issues or incidents happening inside of the application or microservices.
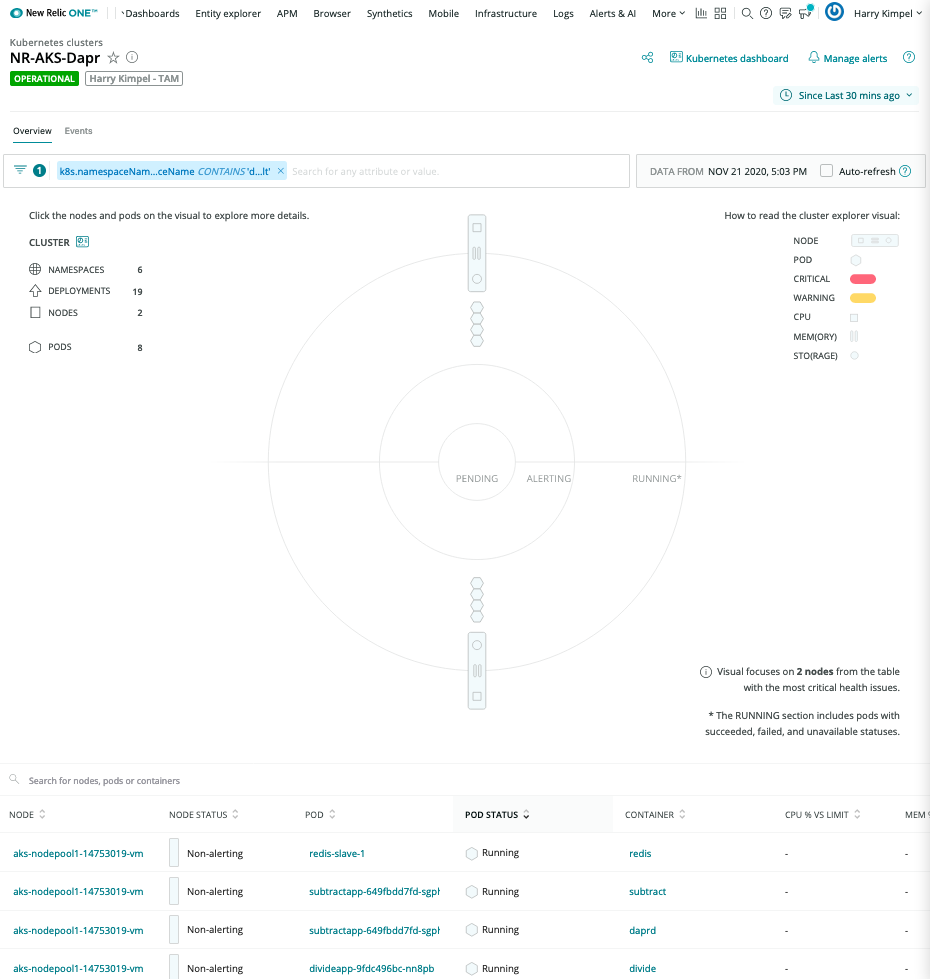
Automated correlation is part of the visualization capabilities of New Relic.
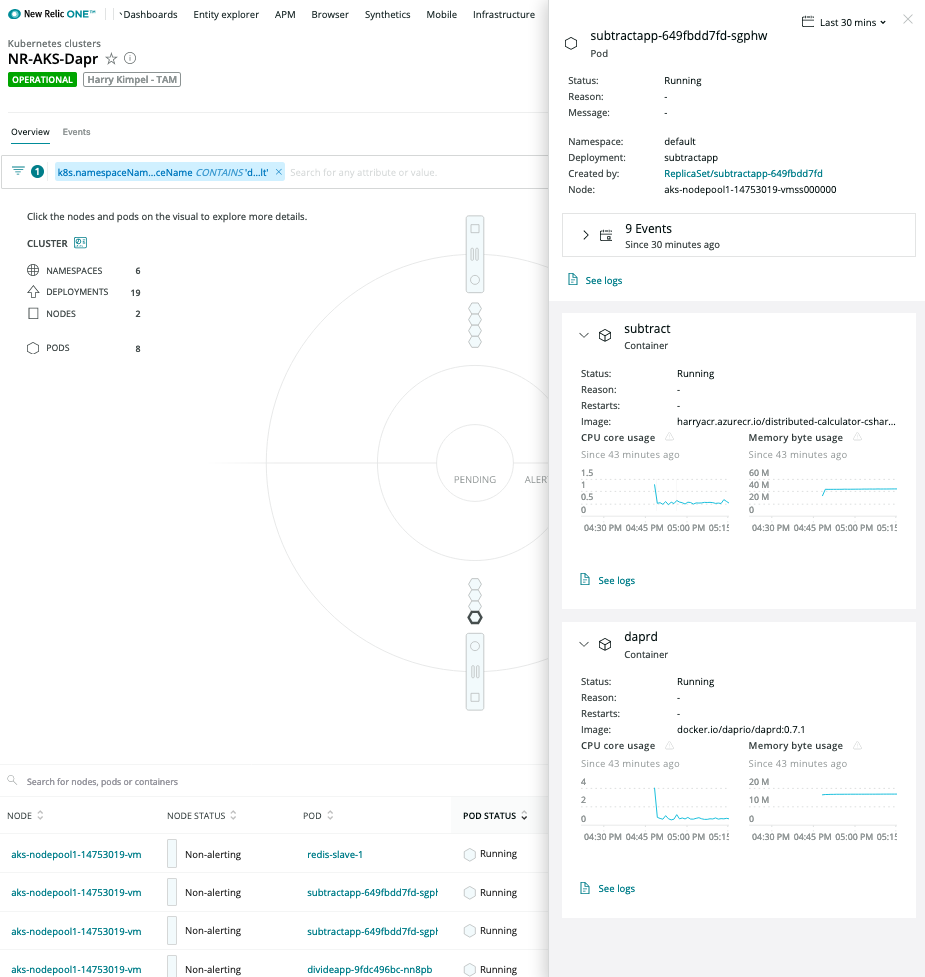
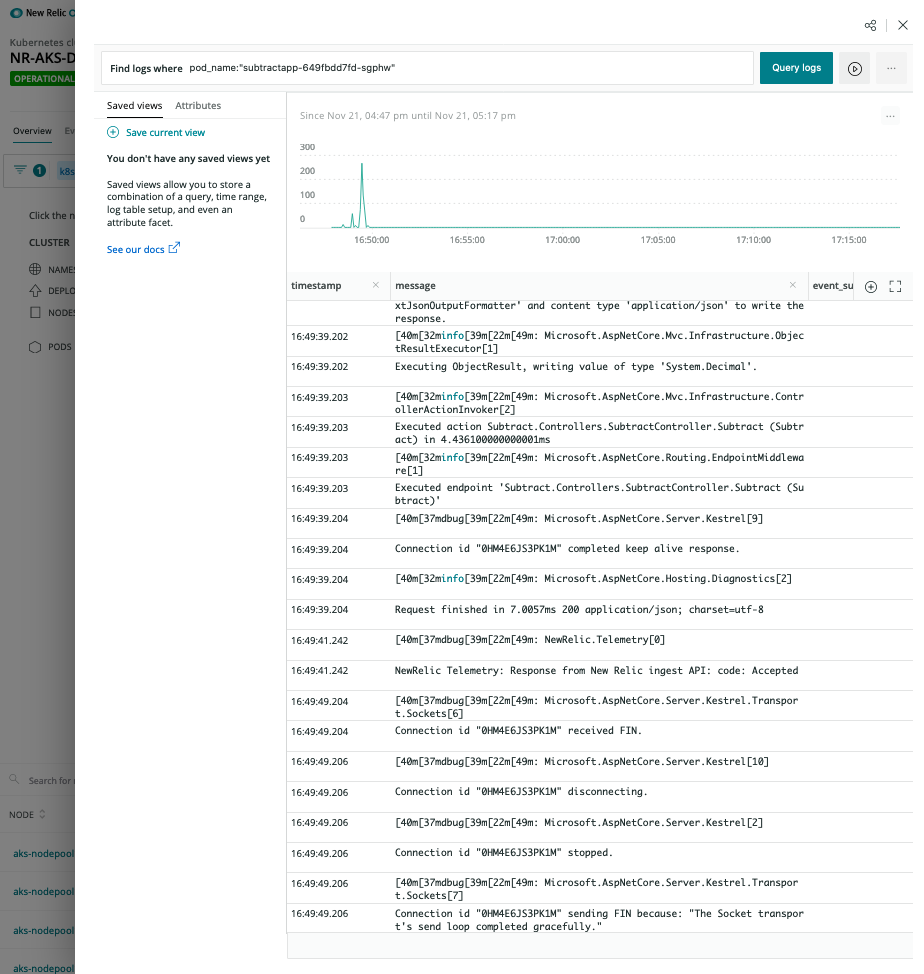
Pod-level details
Logs in Context
New Relic Dashboards
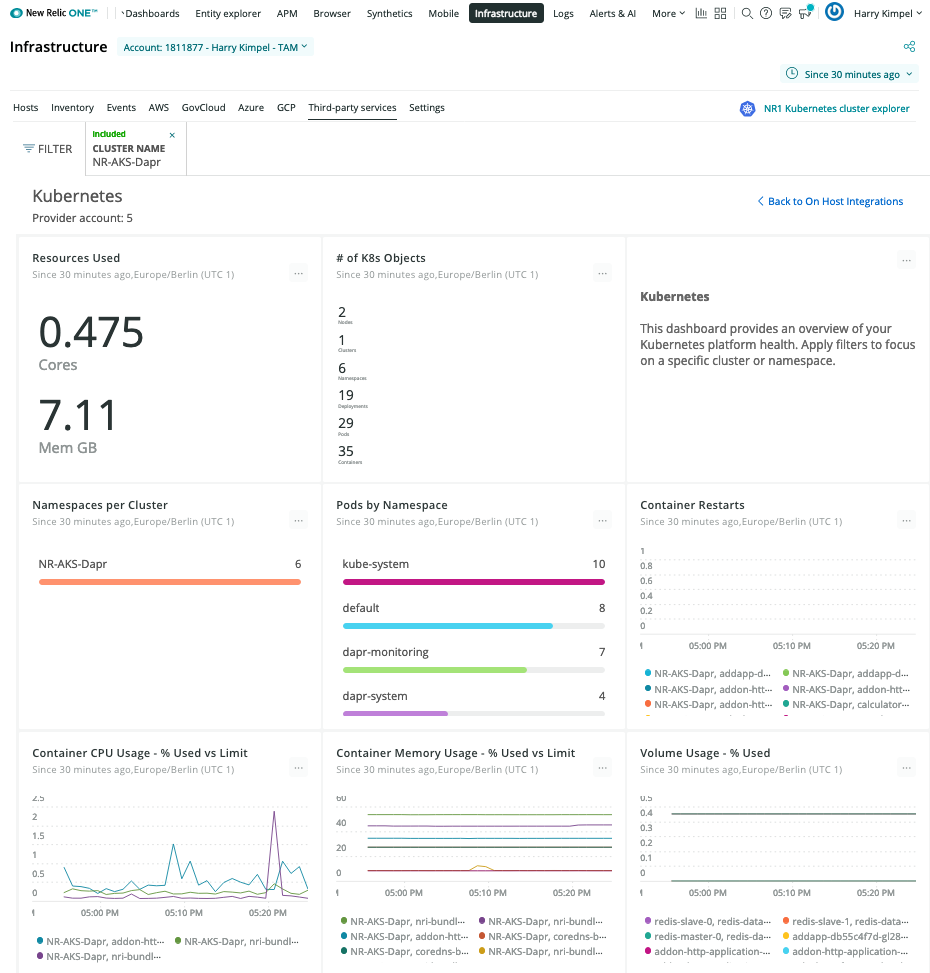
Kubernetes Overview
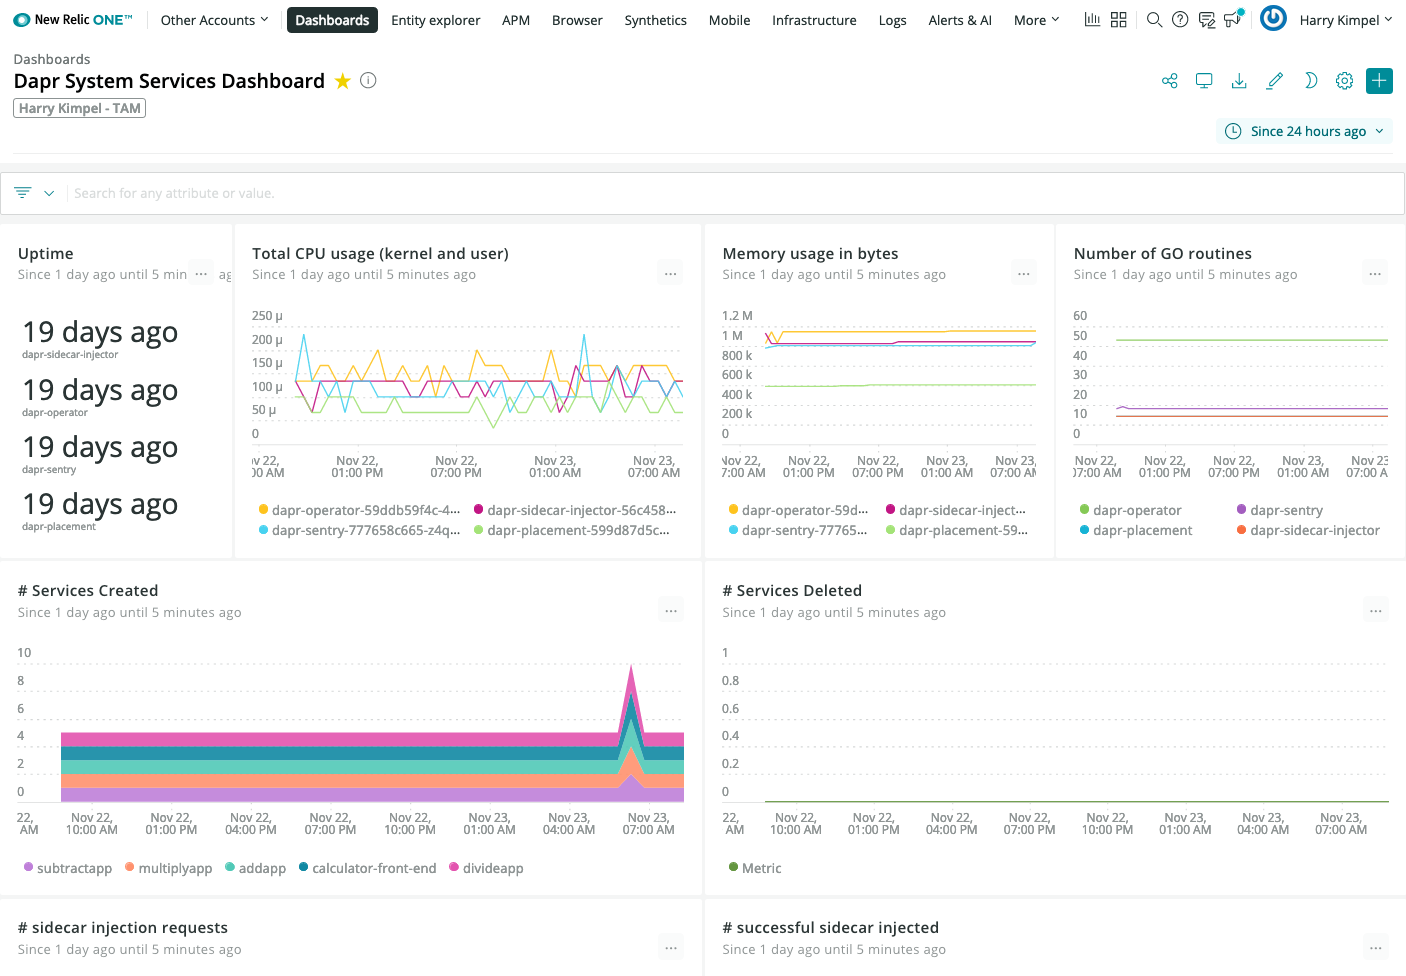
Dapr System Services
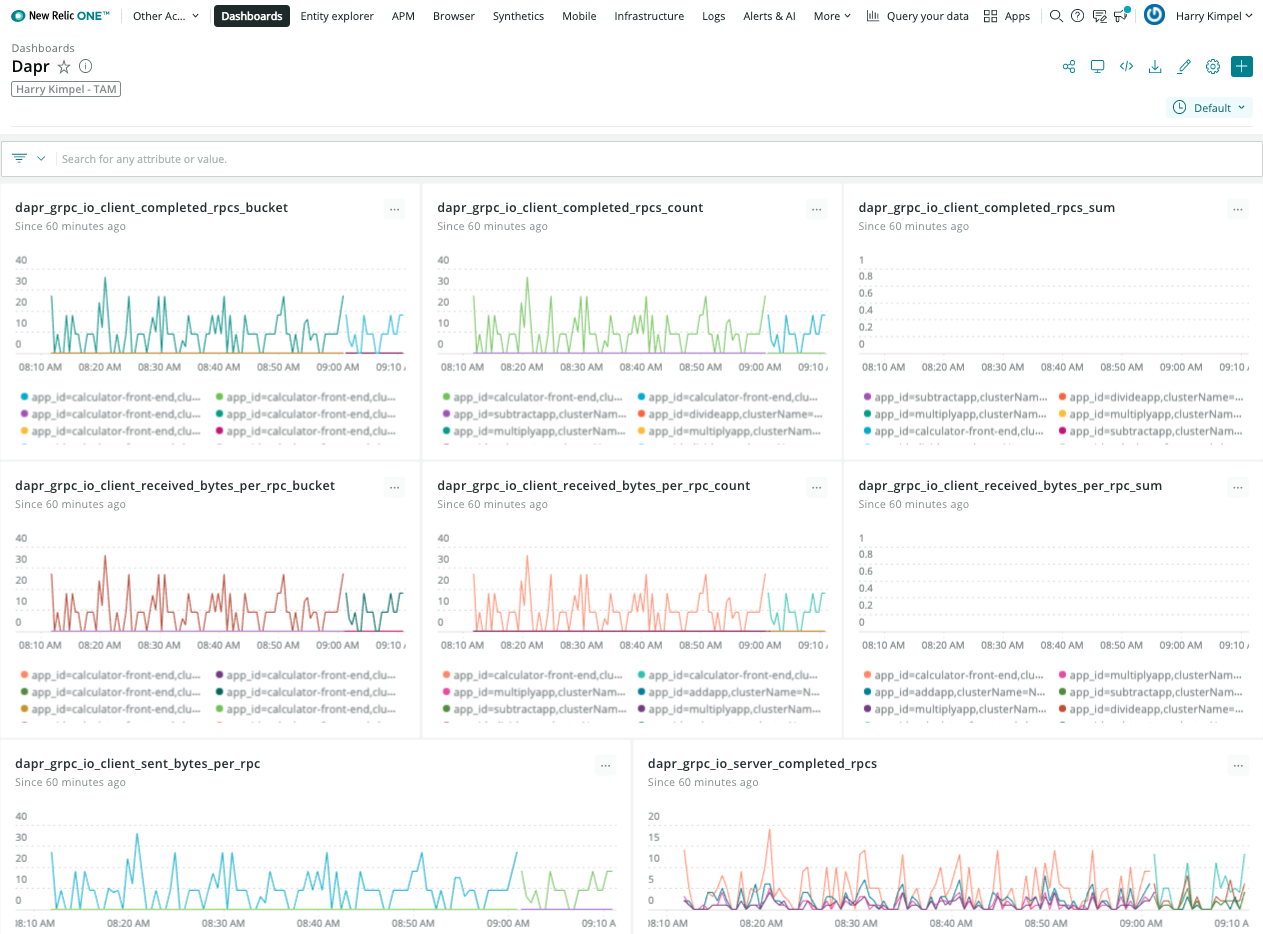
Dapr Metrics
New Relic Grafana integration
New Relic teamed up with Grafana Labs so you can use the Telemetry Data Platform as a data source for Prometheus metrics and see them in your existing dashboards, seamlessly tapping into the reliability, scale, and security provided by New Relic.
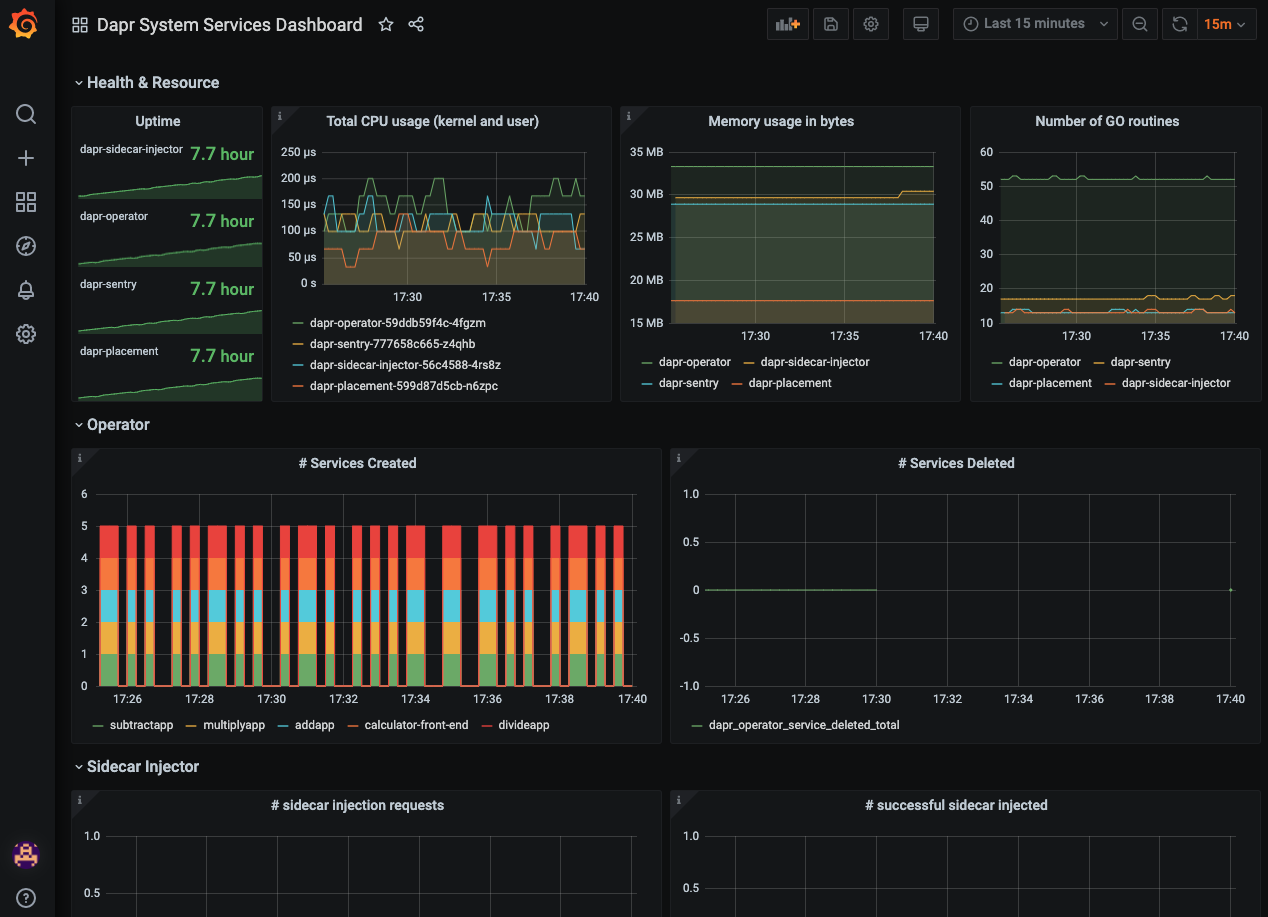
Grafana dashboard templates to monitor Dapr system services and sidecars can easily be used without any changes. New Relic provides a native endpoint for Prometheus metrics into Grafana. A datasource can easily be set-up:
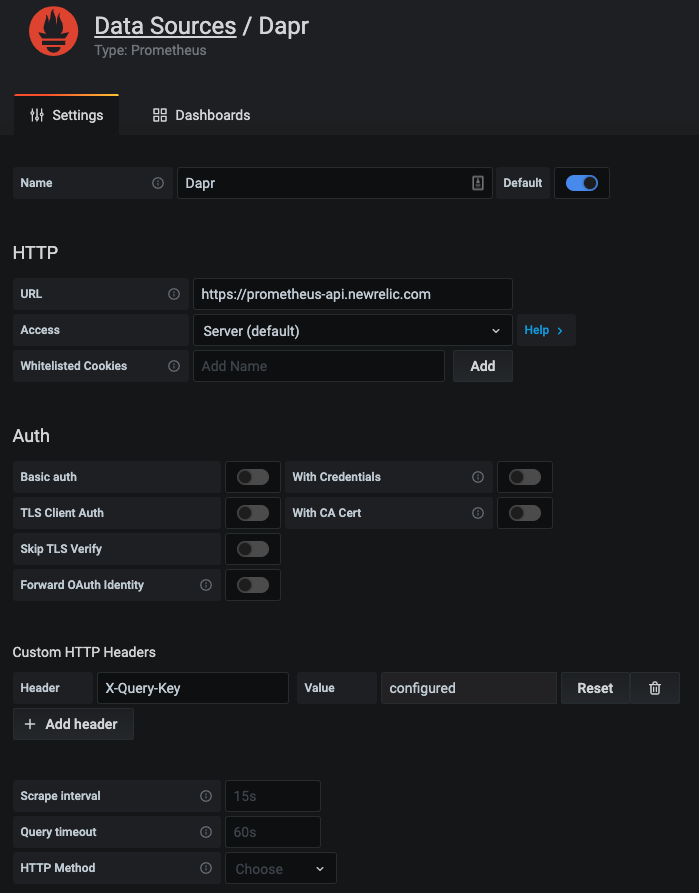
And the exact same dashboard templates from Dapr can be imported to visualize Dapr system services and sidecars.
New Relic Alerts
All the data that is collected from Dapr, Kubernetes or any services that run on top of can be used to set-up alerts and notifications into the preferred channel of your choice. See Alerts and Applied Intelligence.
Related Links/References
- New Relic Account Signup
- Telemetry Data Platform
- Distributed Tracing
- New Relic Trace API
- Types of New Relic API keys
- New Relic OpenTelemetry User Experience
- Alerts and Applied Intelligence
Feedback
Was this page helpful?
Glad to hear it! Please tell us how we can improve.
Sorry to hear that. Please tell us how we can improve.