The documentation you are viewing is for Dapr v1.7 which is an older version of Dapr. For up-to-date documentation, see the latest version.
使用 OpenTelemetry Collector 来收集追踪信息,发送至 AppInsights
Dapr 使用 Zipkin API 与OpenTelemetry Collector 进行集成。 本指南通过一个示例,使用 Dapr 通过 OpenTelemetry Collector 将跟踪事件推送到 Azure Application Insights。
必备条件
在 Kubernetes 上安装 Dapr
如何配置分布式跟踪与 Application Insights
设置 Application Insights
- 首先,您需要一个 Azure 帐户。 请参阅 此处 申请 免费 Azure 帐户的说明。
- 请按照 此处 的说明创建新的 Application Insights 资源。
- 从 Application Insights 页面获取 Application Insights Intrumentation key。
运行 OpenTelemetry Collector 来推送到您的 Application Insights 实例
安装 OpenTelemetry Collector 到您的 Kubernetes 集群,将事件推送到 Application Insights 实例中
-
查看 open-telemetry-collector-appinsights.yaml文件 ,用您的 Application Insights Instrumentation key替换
<INSTRUMENTATION-KEY>占位符。 -
使用
kubectl apply -f open-telemetry-collector-appinsights.yaml来应用配置。
接下来,设置 Dapr 的配置文件以启用应用分布式追踪并部署一个使用 OpenTelemetry Collector 的应用追踪信息导出组件。
-
创建具有此内容的 的 collector-config.yaml 文件
-
使用
kubectl apply -f collector-config.yaml来应用配置
部署你的应用,并启用应用跟踪功能
在 Kubernetes 模式下运行时,通过将dapr.io/config注解添加到要参与分布式跟踪的容器中,从而来应用appconfig配置,示例配置如下所示
apiVersion: apps/v1
kind: Deployment
metadata:
  ...
spec:
  ...
  template:
    metadata:
      ...
      annotations:
        dapr.io/enabled: "true"
        dapr.io/app-id: "MyApp"
        dapr.io/app-port: "8080"
        dapr.io/config: "appconfig"
一些快速入门案例,例如分布式计算器已经配置了这些设置,因此,如果您在使用这些时,则不需要进行其他的设置
就这么简单! 没有必要包含任何的 SDK 或分析您的应用程序代码来确定是否能够支持。 Dapr 自动为您的程序负责了分布式跟踪。
备注: 您可以同时注册多个的应用痕迹跟踪导出器,并且跟踪日志转发到所有已注册的导出器中。
部署并运行一些应用程序。 几分钟后,您应该看到在 Application Insights 资源中出现追踪日志。 您也可以使用 Application Map 来检查您服务的拓扑,如下所示:
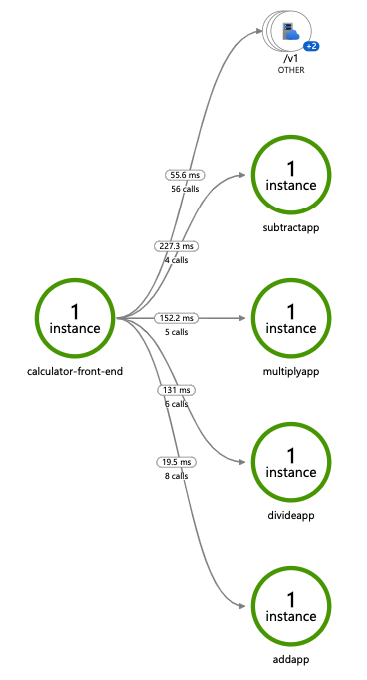
注:只有通过 Dapr sidecar 暴露的 Dapr API 操作(如服务调用或事件发布)才会显示在 Application Map 拓扑中。
相关链接
- 尝试访问可观察性快速入门
- How to set tracing configuration options
Feedback
Was this page helpful?
Glad to hear it! Please tell us how we can improve.
Sorry to hear that. Please tell us how we can improve.