The documentation you are viewing is for Dapr v1.7 which is an older version of Dapr. For up-to-date documentation, see the latest version.
Distributed tracing
Dapr uses the Zipkin protocol for distributed traces and metrics collection. Due to the ubiquity of the Zipkin protocol, many backends are supported out of the box, for examples Stackdriver, Zipkin, New Relic and others. Combining with the OpenTelemetry Collector, Dapr can export traces to many other backends including but not limted to Azure Monitor, Datadog, Instana, Jaeger, and SignalFX.
Tracing design
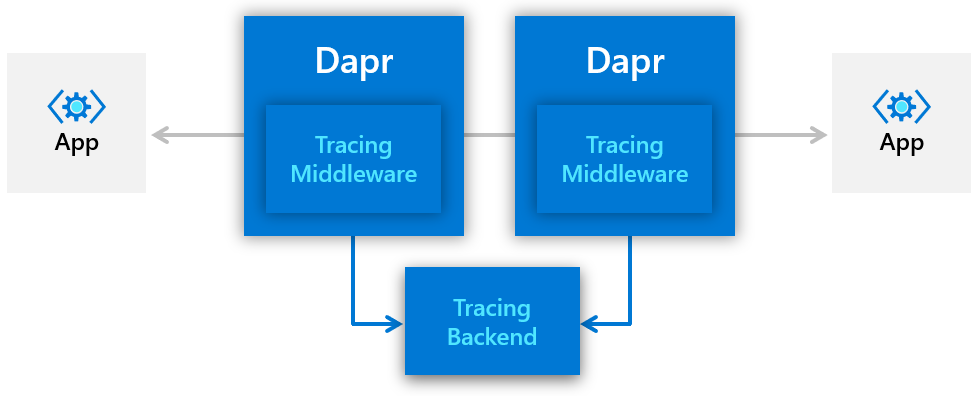
Dapr adds a HTTP/gRPC middleware to the Dapr sidecar. The middleware intercepts all Dapr and application traffic and automatically injects correlation IDs to trace distributed transactions. This design has several benefits:
- No need for code instrumentation. All traffic is automatically traced with configurable tracing levels.
- Consistent tracing behavior across microservices. Tracing is configured and managed on Dapr sidecar so that it remains consistent across services made by different teams and potentially written in different programming languages.
- Configurable and extensible. By leveraging the Zipkin API and the OpenTelemetry Collector, Dapr tracing can be configured to work with popular tracing backends, including custom backends a customer may have.
- You can define and enable multiple exporters at the same time.
W3C Correlation ID
Dapr uses the standard W3C Trace Context headers. For HTTP requests, Dapr uses traceparent header. For gRPC requests, Dapr uses grpc-trace-bin header. When a request arrives without a trace ID, Dapr creates a new one. Otherwise, it passes the trace ID along the call chain.
Read W3C distributed tracing for more background on W3C Trace Context.
Configuration
Dapr uses probabilistic sampling. The sample rate defines the probability a tracing span will be sampled and can have a value between 0 and 1 (inclusive). The default sample rate is 0.0001 (i.e. 1 in 10,000 spans is sampled).
To change the default tracing behavior, use a configuration file (in self hosted mode) or a Kubernetes configuration object (in Kubernetes mode). For example, the following configuration object changes the sample rate to 1 (i.e. every span is sampled), and sends trace using Zipkin protocol to the Zipkin server at http://zipkin.default.svc.cluster.local
apiVersion: dapr.io/v1alpha1
kind: Configuration
metadata:
  name: tracing
  namespace: default
spec:
  tracing:
    samplingRate: "1"
    zipkin:
      endpointAddress: "http://zipkin.default.svc.cluster.local:9411/api/v2/spans"
Note: Changing samplingRate to 0 disables tracing altogether.
See the References section for more details on how to configure tracing on local environment and Kubernetes environment.
References
- How-To: Setup Application Insights for distributed tracing with OpenTelemetry Collector
- How-To: Set up Zipkin for distributed tracing
- W3C distributed tracing
Feedback
Was this page helpful?
Glad to hear it! Please tell us how we can improve.
Sorry to hear that. Please tell us how we can improve.