The documentation you are viewing is for Dapr v1.7 which is an older version of Dapr. For up-to-date documentation, see the latest version.
Observability
When building an application, understanding how the system is behaving is an important part of operating it - this includes having the ability to observe the internal calls of an application, gauging its performance and becoming aware of problems as soon as they occur. This is challenging for any system, but even more so for a distributed system comprised of multiple microservices where a flow, made of several calls, may start in one microservices but continue in another. Observability is critical in production environments, but also useful during development to understand bottlenecks, improve performance and perform basic debugging across the span of microservices.
While some data points about an application can be gathered from the underlying infrastructure (e.g. memory consumption, CPU usage), other meaningful information must be collected from an “application-aware” layer - one that can show how an important series of calls is executed across microservices. This usually means a developer must add some code to instrument an application for this purpose. Often, instrumentation code is simply meant to send collected data such as traces and metrics to an external monitoring tool or service that can help store, visualize and analyze all this information.
Having to maintain this code, which is not part of the core logic of the application, is another burden on the developer, sometimes requiring understanding the monitoring tools’ APIs, using additional SDKs etc. This instrumentation may also add to the portability challenges of an application, which may require different instrumentation depending on where the application is deployed. For example, different cloud providers offer different monitoring solutions and an on-prem deployment might require an on-prem solution.
Observability for your application with Dapr
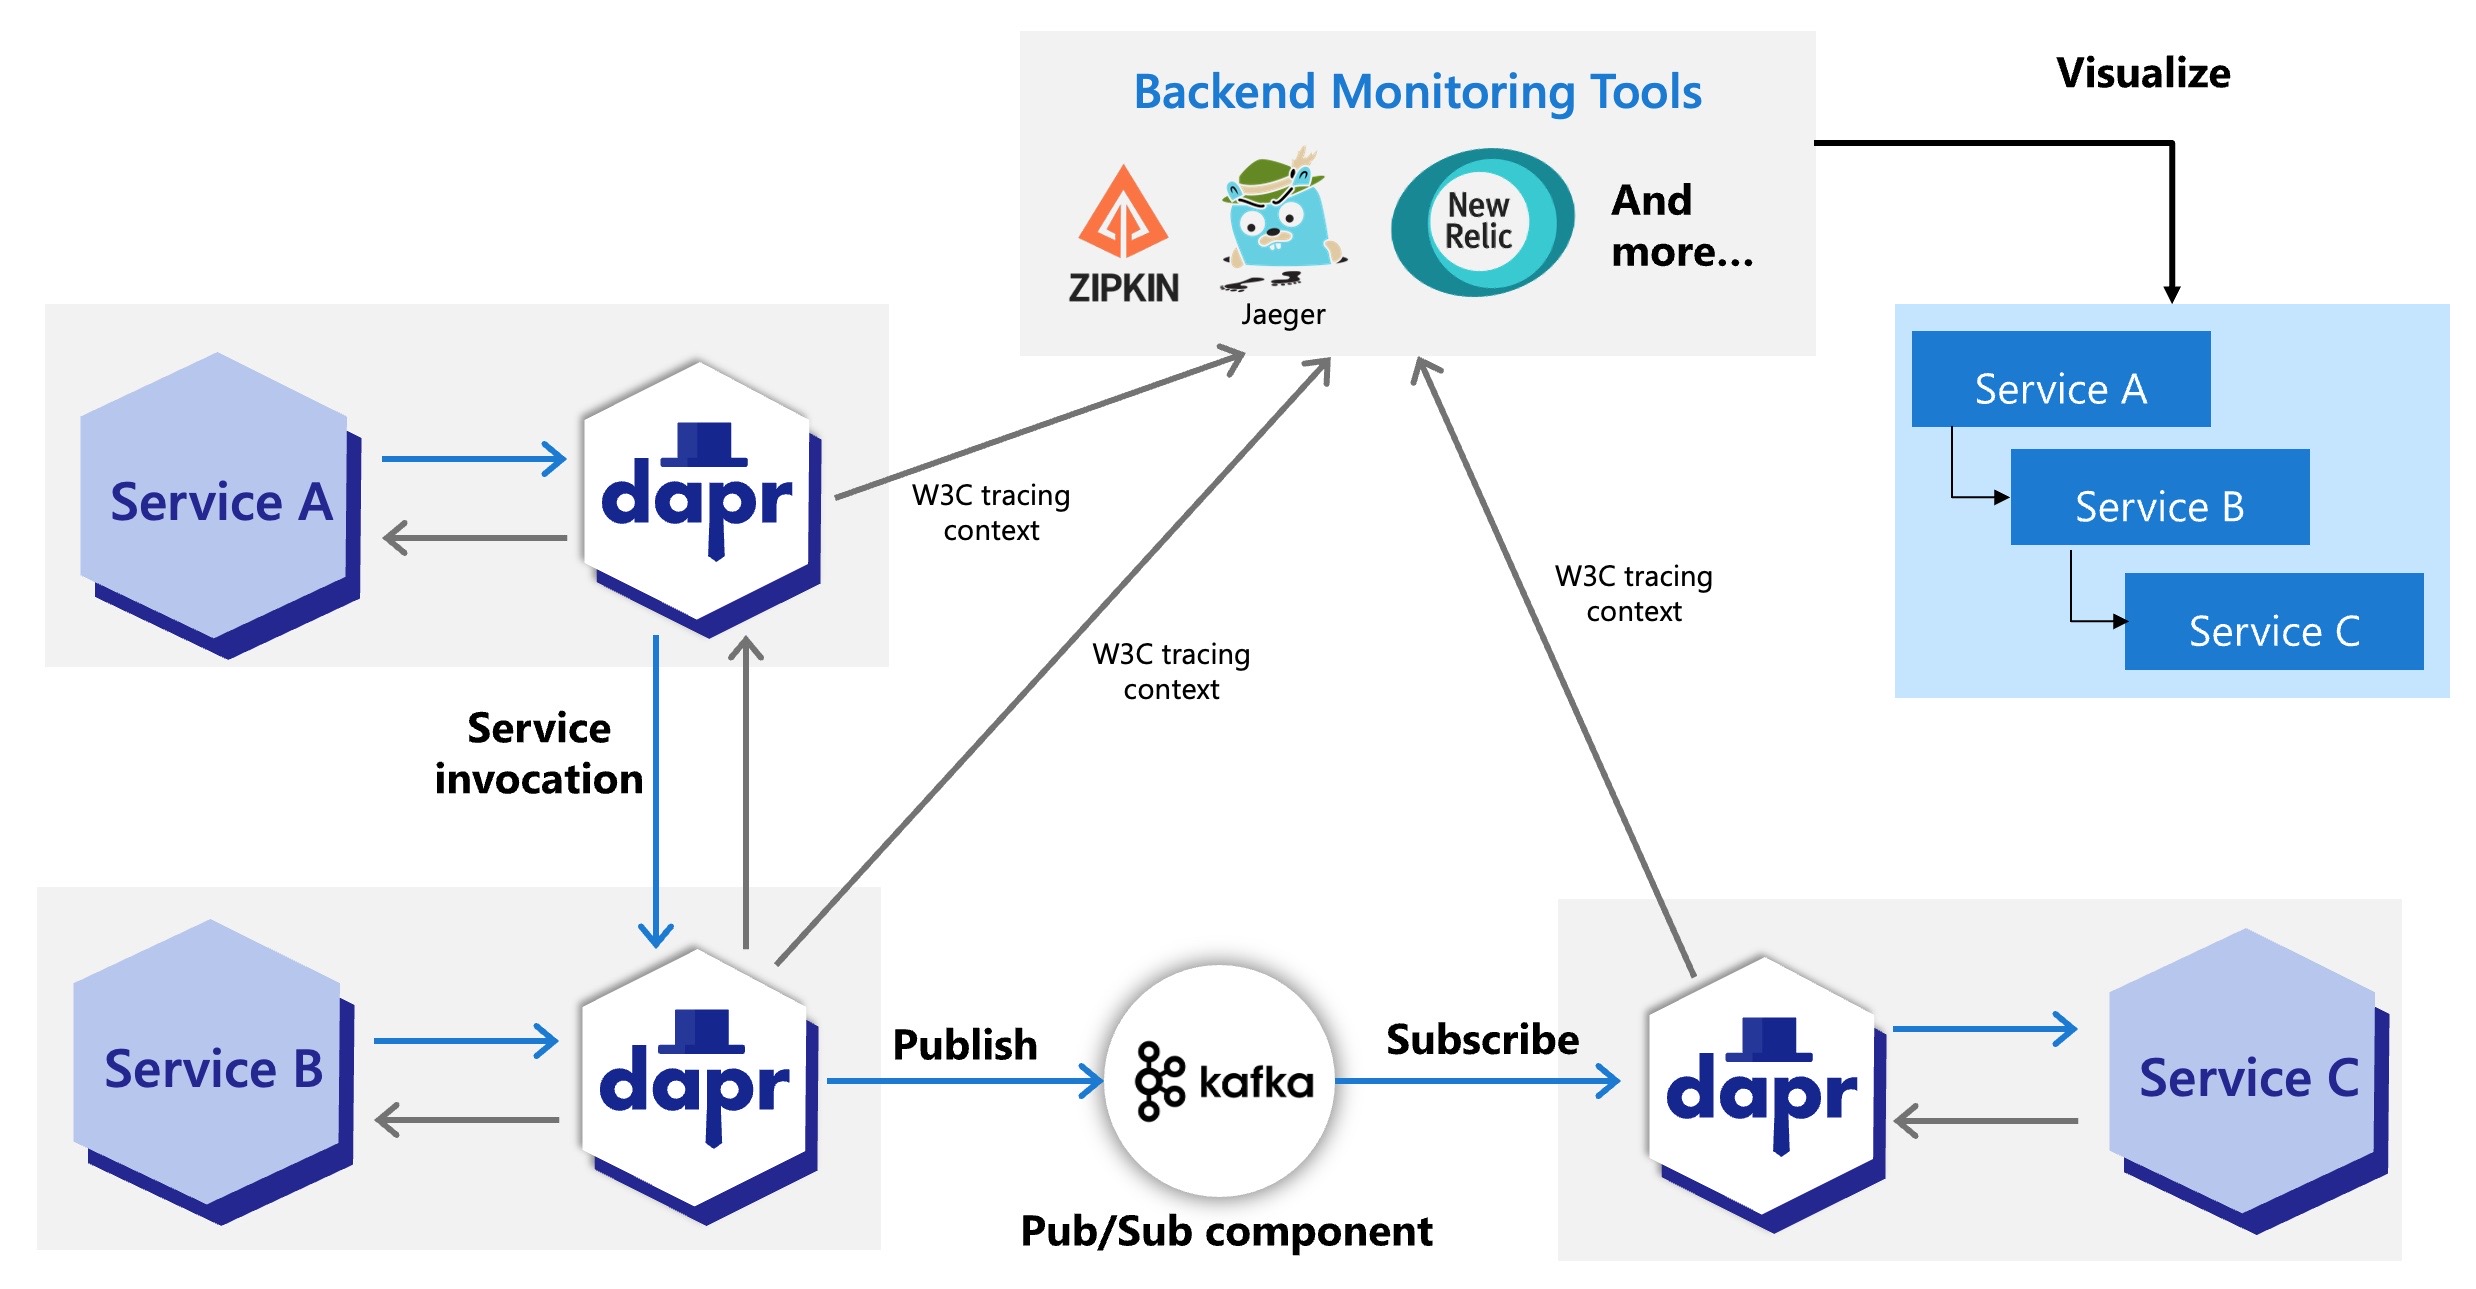
When building an application which leverages Dapr building blocks to perform service-to-service calls and pub/sub messaging, Dapr offers an advantage with respect to distributed tracing. Because this inter-service communication flows through the Dapr sidecar, the sidecar is in a unique position to offload the burden of application-level instrumentation.
Distributed tracing
Dapr can be configured to emit tracing data, and because Dapr does so using widely adopted protocols such as the Zipkin protocol, it can be easily integrated with multiple monitoring backends.
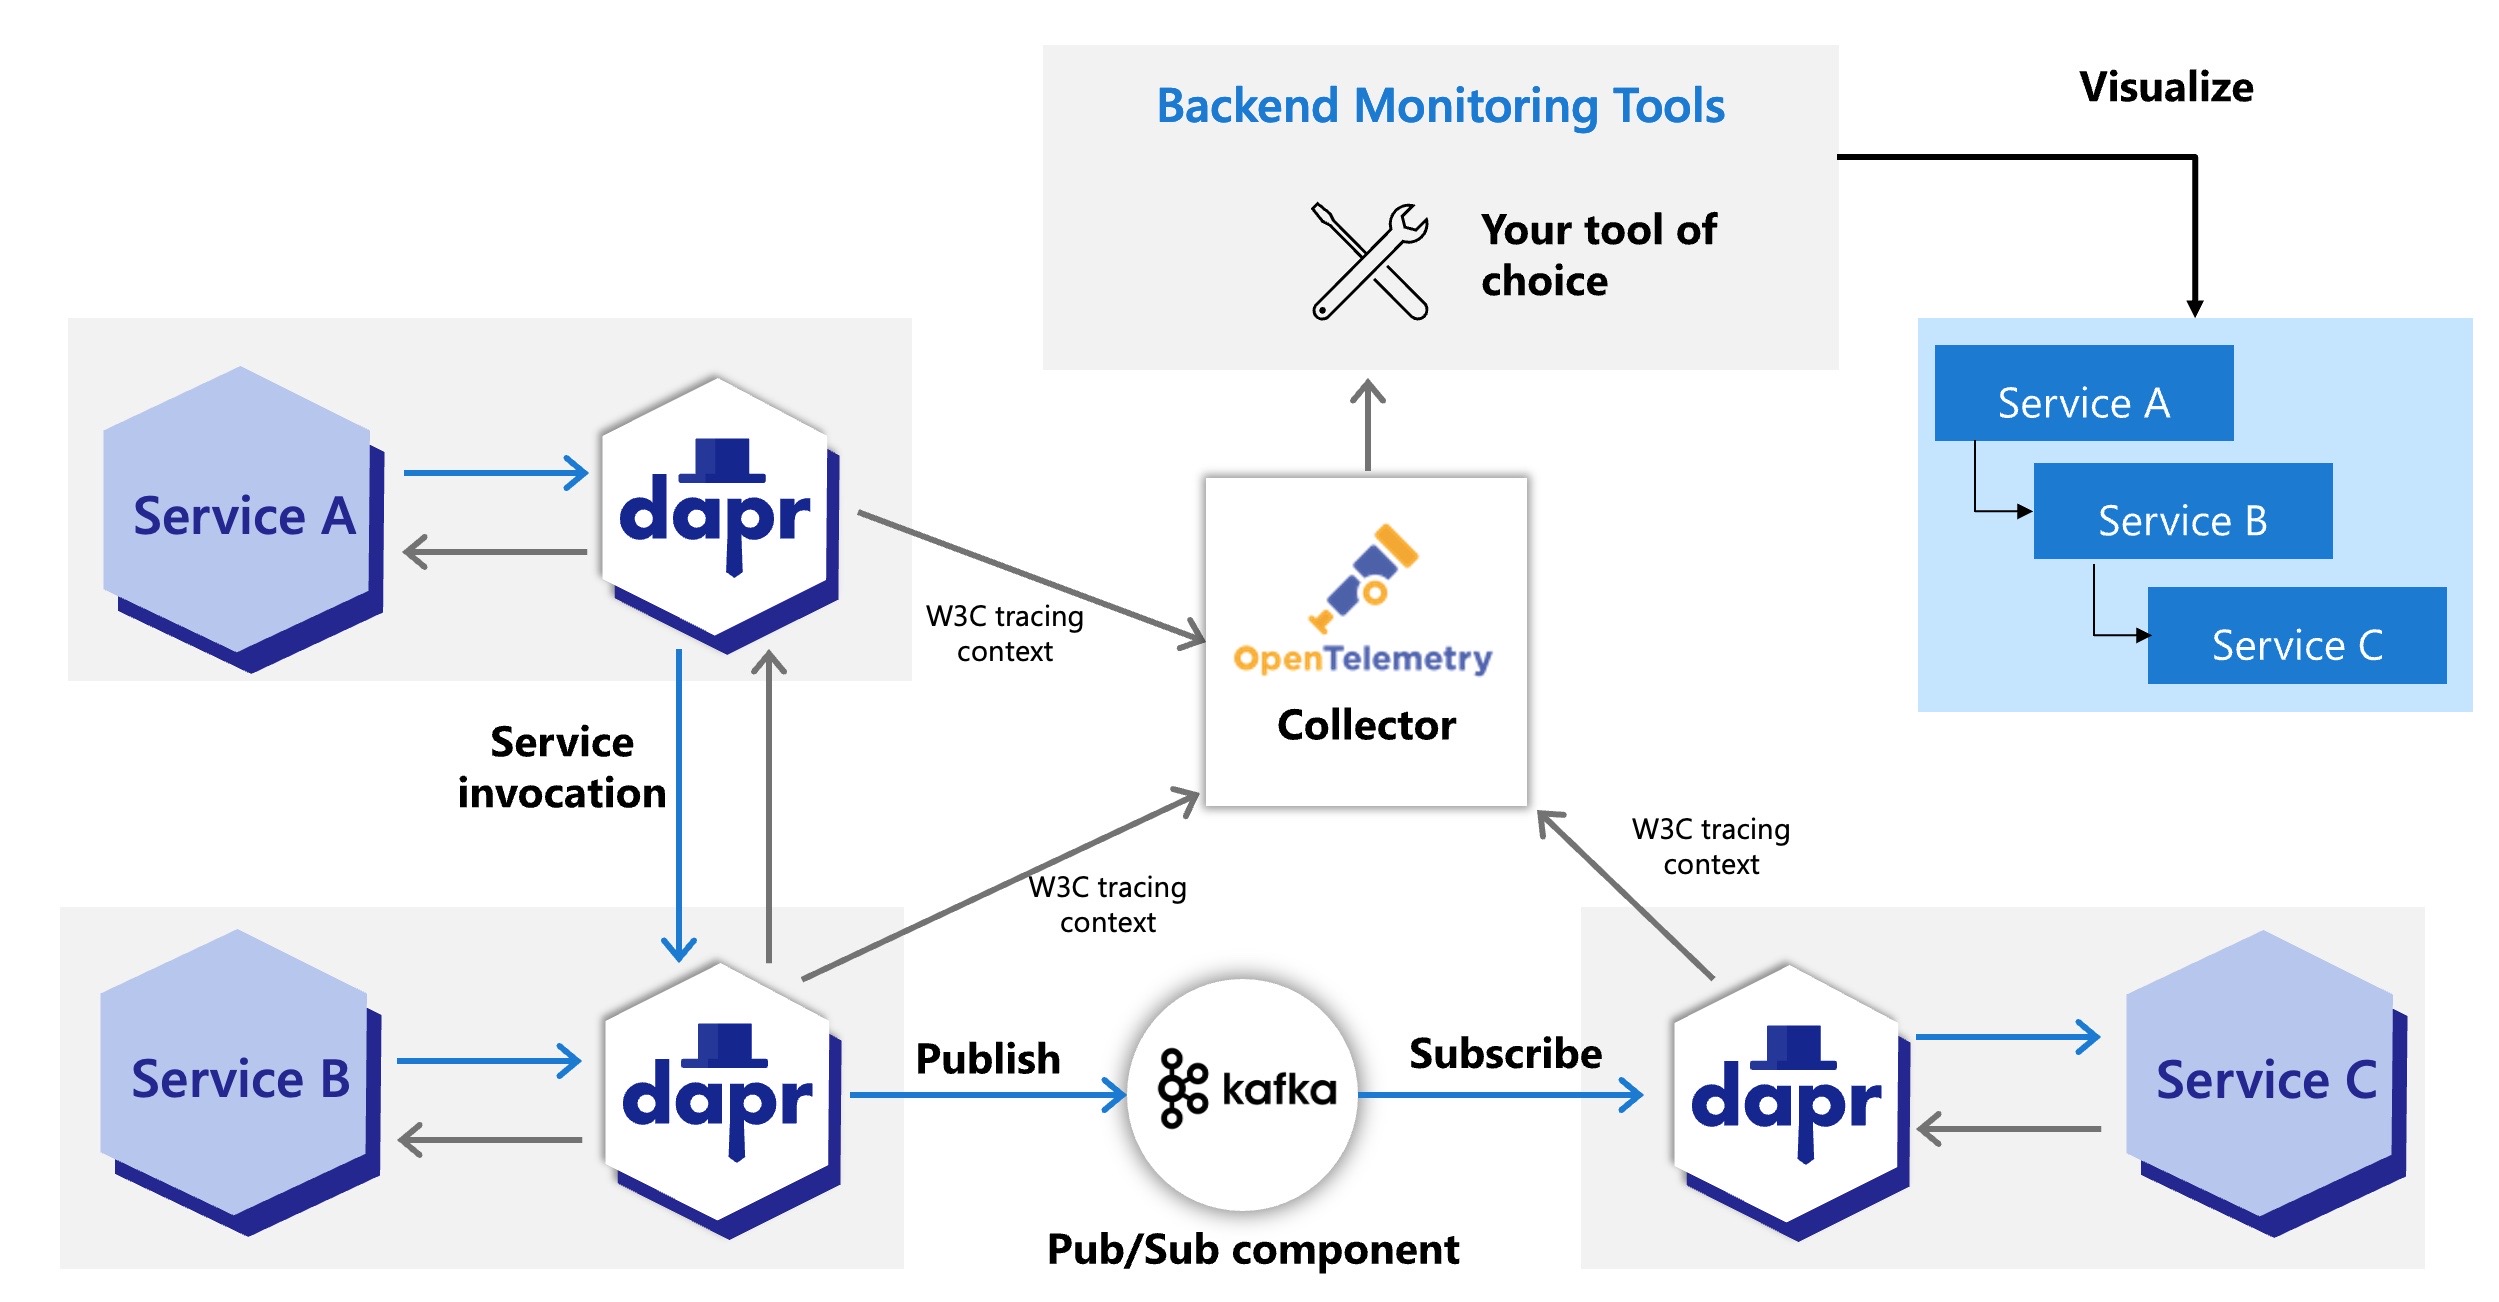
OpenTelemetry collector
Dapr can also be configured to work with the OpenTelemetry Collector which offers even more compatibility with external monitoring tools.
Tracing context
Dapr uses W3C tracing specification for tracing context and can generate and propagate the context header itself or propagate user-provided context headers.
Observability for the Dapr sidecar and system services
As for other parts of your system, you will want to be able to observe Dapr itself and collect metrics and logs emitted by the Dapr sidecar that runs along each microservice, as well as the Dapr-related services in your environment such as the control plane services that are deployed for a Dapr-enabled Kubernetes cluster.
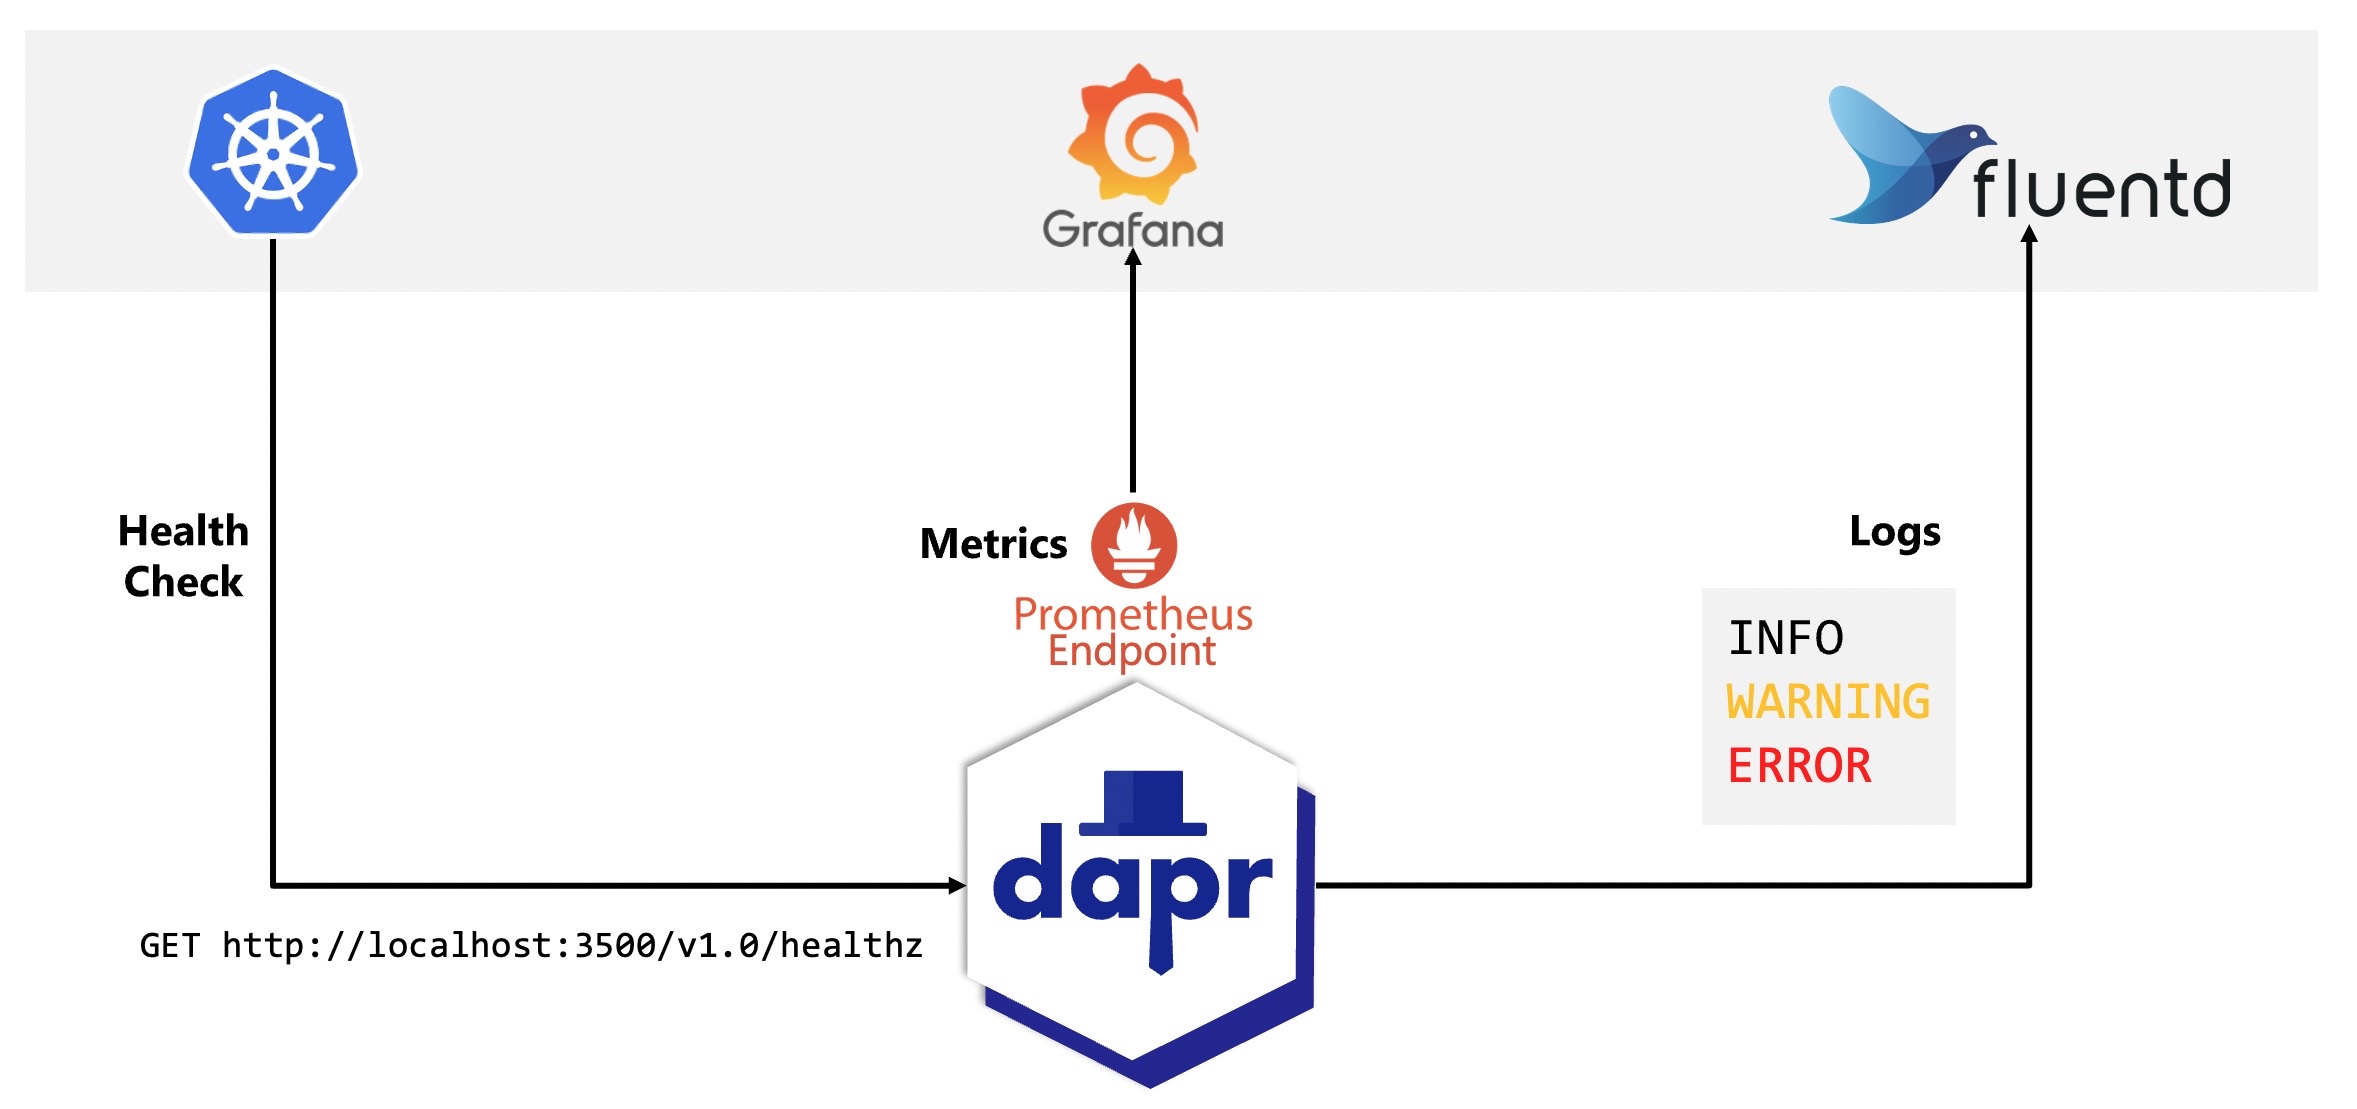
Logging
Dapr generates logs to provide visibility into sidecar operation and to help users identify issues and perform debugging. Log events contain warning, error, info, and debug messages produced by Dapr system services. Dapr can also be configured to send logs to collectors such as Fluentd and Azure Monitor so they can be easily searched, analyzed and provide insights.
Metrics
Metrics are the series of measured values and counts that are collected and stored over time. Dapr metrics provide monitoring capabilities to understand the behavior of the Dapr sidecar and system services. For example, the metrics between a Dapr sidecar and the user application show call latency, traffic failures, error rates of requests, etc. Dapr system services metrics show sidecar injection failures and the health of system services, including CPU usage, number of actor placements made, etc.
Health checks
The Dapr sidecar exposes an HTTP endpoint for health checks. With this API, user code or hosting environments can probe the Dapr sidecar to determine its status and identify issues with sidecar readiness.
Feedback
Was this page helpful?
Glad to hear it! Please tell us how we can improve.
Sorry to hear that. Please tell us how we can improve.